March 9, 2019
Tableau Performance Recipes

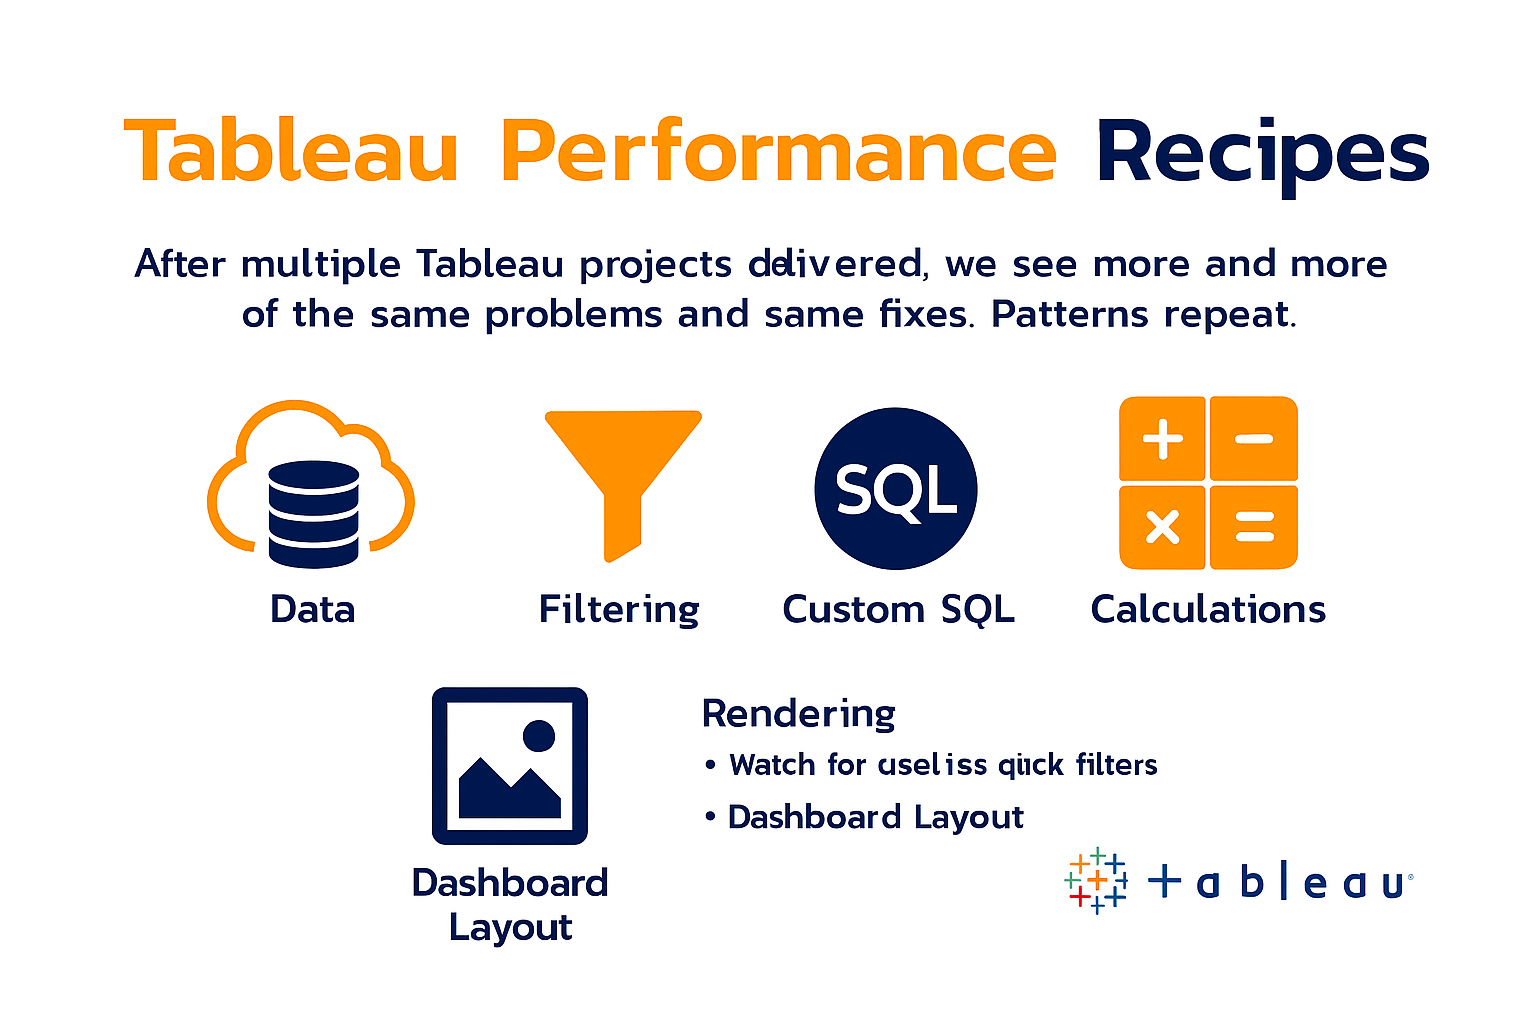
After multiple Tableau projects delivered, we see more and more of the same problems and same fixes. Patterns repeat. Thus we decided to publish a blog with Tableau Best practice. This blog is specifically for performance best practice. We will keep it as compact as possible so reader can get right to the core.
Data
- Bring in only the data needed for analysis. Consider adding a data source filter or using an extract. If using a join, minimise the number of joined tables .
- Remove unused columns (measures/dimensions) in order to minimise extract refresh time or custom SQL query time.
- Hide unused and confidential fields. Roll up data granularity by pre-aggregating or filtering. Break hierarchies to only visible dimensions.

Filtering
- Minimise the number of quick filters. Use dashboard filter actions where possible.
- Avoid selecting “Only relevant values” for your quick filters. This requires sequential queries. Do not use this when not needed.
- Avoid quick filters or actions that drive context filters. These require reloading the context table and should be avoided wherever possible.
- Avoid high-cardinality quick filters (multi-select or drop-down lists). High-cardinality quick filters are slow to load and render.

Custom SQL
- Limit custom SQL in live connections as they can be inefficient. Where possible, create a view on the database server to implement your custom SQL and connect Tableau to your view.
- Avoid parameters in custom SQL in Tableau. Tableau wraps the custom SQL in a subquery that many databases don’t handle well. Consider building a view in the database or use a multi-table join with filters.
- Watch for useless clauses, e.g. ORDER BY. Tableau is going to re-sort the data once loaded anyway.
Calculations
- Use calculated fields carefully. Think about the data type as you code the calculation. Number and Boolean > date > string calculations when it comes to performance.
- Limit blended calculations. They require sequentially querying multiple data sources and can be time-consuming. Where possible, create a view on the database server.
- Avoid row-level calculations involving parameters.
Rendering
- Avoid high mark counts. More marks = longer rendering time.
- Limit the use of detailed text tables with lots of marks.
- Minimise the file size of images or custom shapes where possible. As a general rule of thumb, keep images under 50kb.
- If using custom shapes, use transparent background PNGs instead of JPGs. Views will render cleaner, and shape files will take up less space.


Dashboard Layout
- Limit the number of worksheets on a dashboard. If you have more than four visualisations on a dashboard, strongly reconsider.
- Fix dashboard size relative to end-user consumption. Automatic sizing is less efficient than specifying dashboard size.
Conclusion
We think the content above cover wide range of use cases. But if you have very specific issue, which is not covered. Or you tried it all and still does not work – feel free to reach us out, we are always glad to help!

More News


