October 28, 2016
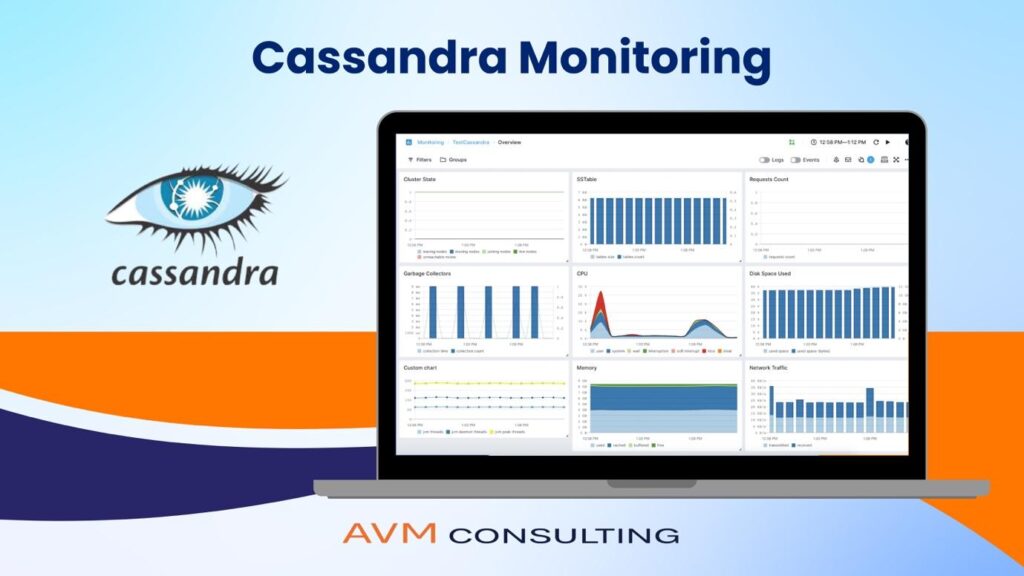
Cassandra Monitoring
Choice of Tool
New Relic
http://newrelic.com/plugins/3legs/113
Monitor Cassandra statistics using the 3legs plugin. Metrics include Read and Write latency (global and per host), Cache statistics, Pending compactions, flushes and more.
Datastax – OpsCenter
http://www.datastax.com/documentation/opscenter/4.1/pdf/opscuserguide41.pdf
DataStax OpsCenter is a visual management and monitoring solution for Apache Cassandra and DataStax Enterprise.
The DataStax agents are installed on the Real-time (Cassandra), Analytics (Hadoop), and Search (Solr) nodes. They use Java Management Extensions (JMX) to monitor and manage each node. Cassandra exposes a number of statistics and management operations through JMX. Using JMX, OpsCenter obtains metrics from a cluster and issues various node administration commands, such as flushing SSTables or doing a repair. It monitors a variety of metrics at the system and cassandra cluster level including performance and column family metrics.
JConsole
JConsole is a graphical monitoring tool to monitor Java Virtual Machine (JVM) and Java applications both on a local or remote machine.
JConsole uses underlying features of Java Virtual Machine to provide information on performance and resource consumption of applications running on the Java platform using Java Management Extensions (JMX) technology.
JConsole comes as part of Java Development Kit (JDK) and the graphical console can be started using “jconsole” command.
Nagios
http://exchange.nagios.org/components/com_mtree/attachment.php?link_id=3819&cf_id=24
For Cassandra, foll. metrics are monitored:
Storage Load – The amount of data stored on each Cassandra node
Pending Tasks – The number of basic task stages waiting to run
Active Tasks – The number of basic task stages currently running
Blocked Tasks – The number of basic task stages blocked from running
Pending Internal Tasks – The number of internal task stages waiting to run
Active Internal Tasks – The number of internal task stages currently running
And foll. JVM Metrics
Active JVM Threads
JVM Heap memory usage
JVM Non-Heap memory usage
Monitoring through Datastax OpsCenter
Installing OpsCenter Console 4.1
Configure /etc/yum.repos.d/datastax.repo
sudo yum install opscenter
service opscenterd start
Connect to the console using http://:8888 Add an existing Cassandra cluster from the Console, by clicking on “Add Cluster” and adding the IP of one of the Cassandra Cluster Nodes (JMX Port:7199, Thrift Port:9160)
All the nodes in the cluster are now identified.
/etc/opscenter/opscenterd.conf is the configuration file
Installing OpsCenter Agent
Add the DataStax Yum repository in the /etc/yum.repos.d/datastax.repo file
yum install datastax-agent
In address.yaml set stomp_interface to the IP address that OpsCenter is using.
echo "stomp_interface: 10.132.56.93"|tee -a /var/lib/datastax-agent/conf/address.yaml
If SSL communication is enabled in /etc/opscenter/opscenterd.conf , use SSL in address.yaml.
echo "use_ssl: 1" | sudo tee -a /var/lib/datastax-agent/conf/address.yaml
Start the DataStax agent.
service datastax-agent start
Perform above step on each node in the cluster
Configuring Access
python /usr/share/opscenter/bin/set_passwd.py <username> admin
service opscenterd restart
Enabling HTTPS
vi /etc/opscenter/opscenterd.conf and uncomment the ssl lines
Restart Opscenter daemon
Access console with https://:8443/opscenter/index.html
HA Setup for OpsCenter
Configure VIP and attach it to Primary Opscenter
On Standy Opscenter, copy all the necessary congfis.
On agent side, configure communication to VIP
#Metrics and Alerts Configuration
All configured alerts in the console are stored in OpsCenter Keyspace, in column family Settings, with rowkey global-cluster-alert-rules and each column will represent a metric alert
We need to identify the metrics and thresholds we want to monitor.
We are not using the mail alerting feature, instead we are using the Web URL alerting feature to send mails. This is because the mail alerting feature is not configurable to send mails to different DLs based on the threshold and also customize the mail subject. (The subject will always be static, whereas we want it to have format like alert_level:hostname – alert name
Configure Apache Web Server
yum install
httpd /sbin/service httpd start
Configuring PHP for Apache
yum install php --> to install the libphp5 module?
vi /etc/httpd/conf/httpd.conf --> and add below line
LoadModule php5_module modules/libphp5.so
Configuring Sendmail
yum install sendmail
sendmail.cf and submit.cf
Configuring the Alerting Script
cat /etc/opscenter/event-plugins/posturl.conf
[posturl]
enabled=1 url=http://<hostname>/postOPSCevents.php # levels can be comma delimited list of any of the following: # DEBUG,INFO,WARN,ERROR,CRITICAL,ALERT # If left empty, will listen for all levels levels=WARN,ERROR,CRITICAL,ALERT
This script will send warning to Warning mail_id and critical alerts to Critical mail_id.
Monitoring through New Relic
https://github.com/threelegs/newrelic-plugins
Download the plugin from above link onto one of the nodes in the cassandra cluster. Else you can download from New Relic Console, under Plugins Section.
ls /tmp/newrelic_3legs_plugin-0.0.2-cassandra.tar.gz
/tmp/newrelic_3legs_plugin-0.0.2-cassandra.tar.gz
cd /root/ gunzip newrelic_3legs_plugin-0.0.2-cassandra.tar.gz
cd config
Configure activation.conf, application.conf, newrelic.properties, /etc/init.d/newrelic_3legs
/sbin/service newrelic_3legs start
Now on New Relic Console, you could see Cassandra on the left hand side clicking which you could see the cluster PCS-Cassandra we configured.
Even with one host agent running, it was showing metrics for all hosts
Click on the Settings icon and configure thresholds for Read Latency, Write Latency and Down Hosts.


More News