March 11, 2019
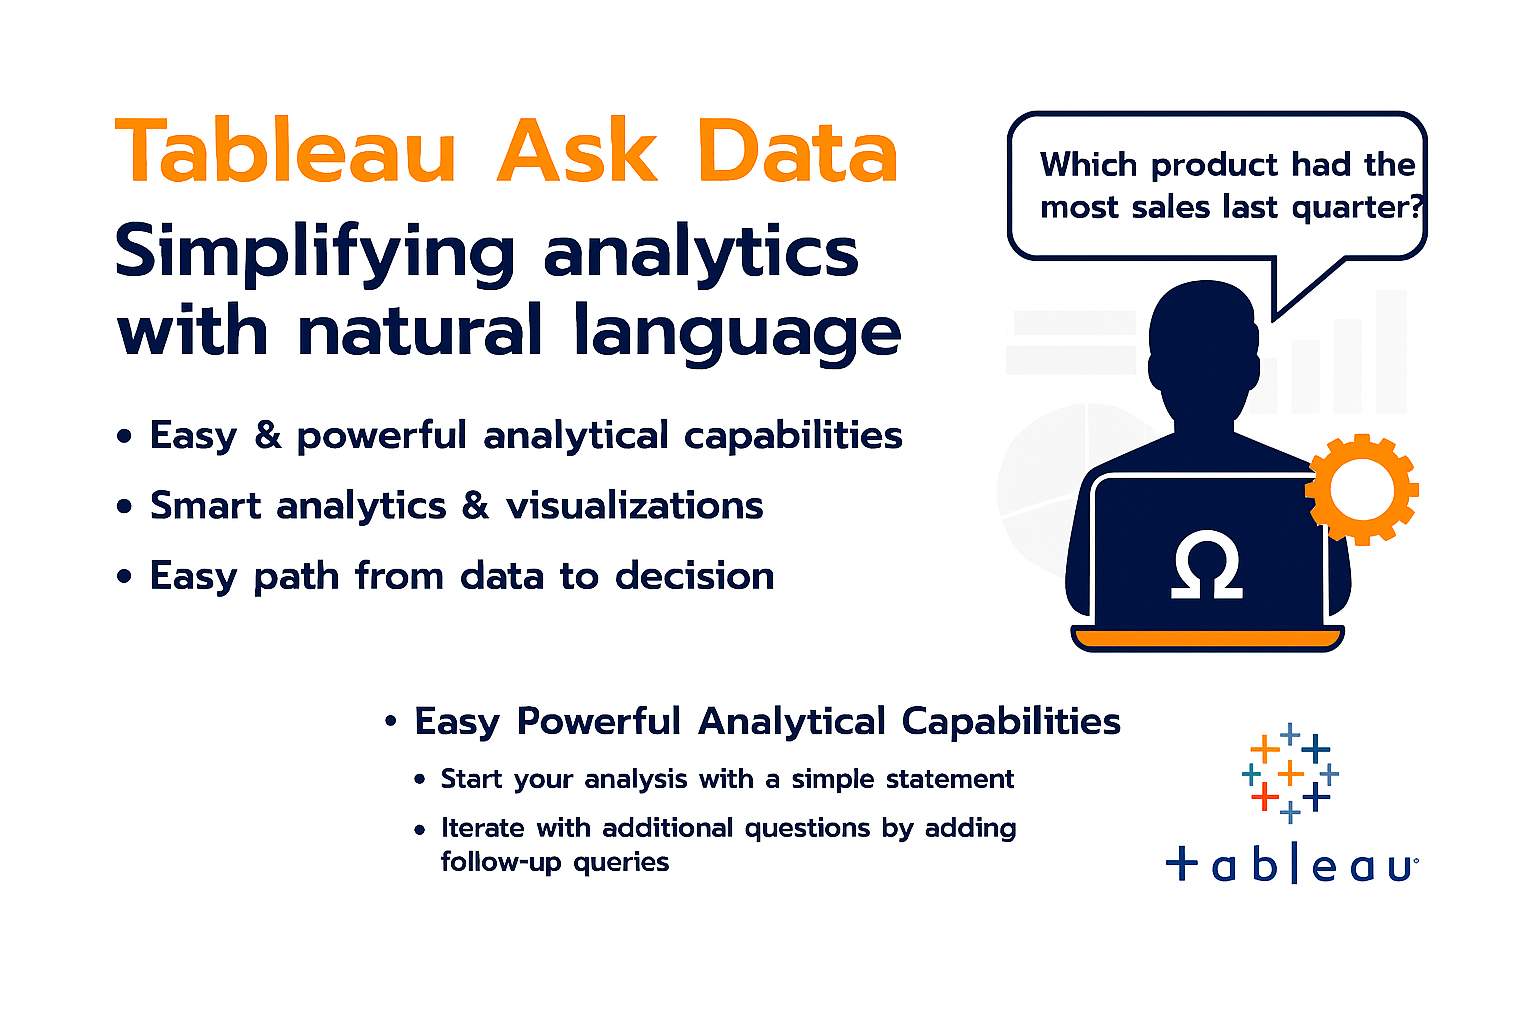
Tableau Ask Data

Simplifying analytics with natural language
With Ask Data, anyone can easily ask questions of their data regardless of expertise. It is available at no extra charge as part Tableau’s newest release, Tableau 2019.1.
Ask Data interprets the intent behind ambiguous and vague questions to give you accurate results. You can continuously refine your question as you explore your data, then share the findings with others as a Tableau workbook.
It is a Self service analytics available for both Tableau Server and Online, for both live and extract that throws out a visualisation when you ask a question, empowering every individual in an organisation with the ability to ask questions and get quick answers and make better, data-driven decisions. It is as simple as select a data source and type in a question and no setup is required.

Easy Powerful Analytical Capabilities
- Start your analysis with a simple statement or question
- Iterate with additional questions by adding follow-up queries
- Ask Data enriches the semantic model with metadata about the field – when you ask “net sales atleast”, it is able to pick the right column that represents net sales. Metadata also contains the most commonly occurring string values, it internally builds this metadata through a continuous learning process form our usage patterns.
- Use Global synonym enrichment across data sources – For eg. an attribute called “sales” you can directly add other synonyms such as revenue, income, earnings. This enables users to use more natural language in their questions.
- With Smart Analytics, it is able to decipher context, and also understand underspecified or ambiguous statements
- It incorporates data visualization best practices, it is able to pick the right visualisation for you based on the question you ask, but you also have a choice of changing it.
- Curate data sources for a successful user experience, this includes having proper column names, adding synonyms/aliases for your columns, having all related data as one datasource, etc.
- It provides an easy path for Business people in going from data to decision
Understanding people utterances – How does this work
- Ask Data breaks utterances into tokens, For eg. When you ask the question “What is the profit over time”, it breaks understands as below. Profit => this is understood as sum (the default aggregation) Time => it picks attribute Order date aggregated at the year level
- It also handles Misspelling
- It is able to resolve ambiguity – For eg, when you ask the question “2013 orders” to get you the orders for year 2013, it understands 2013 is year and not no. of records. It learns from usage and interprets accordingly.
- It tries to fill in the missing question or underspecified utterances – for eg. when asked “net sales over time”, it tries to interpret “over time” as yearly sales by choosing the appropriate date column.
- It also understands the language, for eg, most popular, most expensive are translated as an analytical query like “get the maximum of price column”.
Supported Analytical Expressions
- Aggregation expressions – Sum of Sales, Average Profit, Count of Customers
- Group expressions – group by Region, by Shipping Method
- Sort expressions – Ascending, Descending, Alphabetical
- Filter expressions – Product Category contains Nutrition, sum of sales atleast 1000$
- Limit Expressions – top 5 products by count of orders


Preparing Data sources
- Avoid column names which resemble analytical expressions (e.g. “Sales_in_2015” or “Average_Products_Sold”)
- Remove redundant columns when joining different data sources
- Ask Data supports data sources with up to 1,000 fields, but the less ambiguity, the better
- Curate your data with end users in mind
- Setup logical hierarchies – Define a geographic role for place fields like City, State, or Country, and combine related fields into hierarchies for more accurate display of data in map visualizations.
- Create meaningful aliases / synonyms – Rename attributes as human readable, use value aliases to rename values before publishing datasource, Avoid using overlapping names and phrases
- Add relevant calculated fields – Predefine calculated fields which perform common calculations you want to use in natural language queries (e.g. Profit Margin = [Income] / [Revenue])
- If the datasource is slow, use a data extract with datasource filters (if needed) to improve. You might want to experiment with both options to see which works best for you..
Ask Data Examples
| Ask Data Question | Equivalent Analytical Interpretation | Comments |
|---|---|---|
| Recent sales for Iphone in Calli | select month, sum(sales) from sale_details where year >= 2018 and product_category=‘IPhone’ and state=‘California’ group by month | Understands recent is last year, IPhone is a product category and Calli is state California |
| What are the sales figures/productivity last week/month | select day, sum(sales) from sale_details where year_month >= 122018 group by day | – |
| How many products are there | select distinct count of product type | – |
| Top 10 most expensive products | select product_category, max(price) max_price from sale_details group by product_category order by max_price desc limit 10 | – |

More News


